
Every website owner must be aware of his website’s response time. You must ensure that your website responds promptly, allowing your visitors to enjoy a seamless user experience with the right kind of engagement.
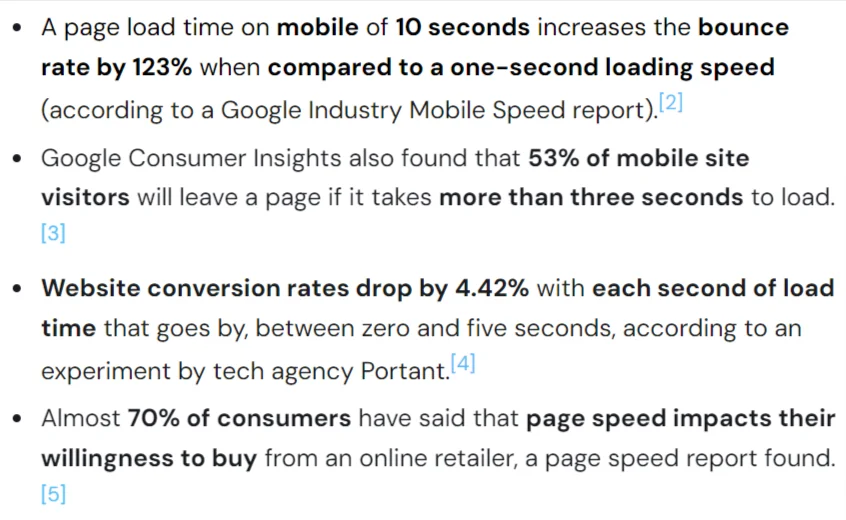
Tooltester.com surveyed more than 4 billion web visits in the last year. The primary purpose was to determine the factors affecting website loading speed. This survey also highlighted the sources of slow loading speed.
Please have a look at the following snap.
Also Read: How to Ensure if a Website is Secure?
What is Website Response Time?
Let’s begin by understanding what is website response time. The simple answer is the duration a web server takes to respond to a user’s request after they input a URL or click on a link.
Actually, the website response time is an important performance metric that influences user experience. A quick response time allows for smoother navigation and improves visitor satisfaction.
Factors influencing response time are:
- Server performance,
- Website hosting quality
- The complexity of the web page
- The size of images and (length) of scripts.
As a rule of thumb, a response time of under 2 seconds is acceptable. Anything higher can result in higher bounce rates and negatively affect search engine rankings.
Also Read: How to Fix the 504 Bad Gateway Timeout Error?
Importance of Website Response Time
Your website response time is vital for ensuring a positive user experience, creating an online presence, and building your brand value.
A quick and minimum response time keeps your user happy. When your website loads faster, visitors get inspired to stay longer and explore various pages of your website. It leads to higher conversion rates with bright chances of visitors converting to prospects.
When your website responds slowly, users get frustrated, soon abandon your site, and start searching for alternative websites that load fast.
Website loading time is an important ranking factor for search engines.
Hence, search engines like Google keep an eye on your website’s loading time. Faster sites have a probability of ranking higher in search results.
By focusing on faster website response time, you can ensure customer retention. With quick-loading web pages, you can boost user engagement and improve overall brand performance.
Also Read: How to Fix the err name not resolved Chrome
What does Google say about website response time?
Google has also acknowledged the importance of fast website loading. Hence, it has started rewarding websites that offer a positive user experience. Google considers criteria like page load speed and mobile friendliness to decide search result rankings.
Experts caution that a slow-loading website will result in increased bounce rates and reduced customer satisfaction. Hence, webmasters and business owners must monitor the site’s performance closely.
This guide will explore various methods and tools to effectively check the response time of a website and how to optimize the site’s performance for better results.
Also Read: What is HSTS & How to Implement on your website?
Methods to Check the Response Time of a Website
You can check your website’s response time with various tools. They help you analyze load times and provide insights into performance.
➢ Using Browser Developer Tools
By using browser developer tools, you can easily check your website’s response time. All you have to do is navigate to the ‘Network’ tab and check the loading times for each resource. Identify bottlenecks and optimize performance for a smoother user experience.
➔ Steps to check response time in different browsers
Let’s understand the steps involved for each browser.
1. Google Chrome
To check response time in Google Chrome, you can use the built-in Developer Tools. Here are the steps:
Step 1: Go to the Google Chrome browser & open the website for which you have to check the response time.
Step 2: Access Developer Tools by clicking on three dots.

Step 3: Go to ‘More Tools.’

Step 4: In that, go to ‘Developer Tools’

Note: Alternatively, you can press Ctrl + Shift + I (Windows) or Command + Option + I (Mac) to open Developer Tools.
Step 5: In the Developer Tools panel, click on the ‘Network’ tab. This tab allows you to monitor network activity for the page you’re inspecting.

Step 6: To capture the response time for all network requests, reload the page while the Network tab is open. You can do this by pressing the F5 function key or clicking the refresh button in the browser.
Step 7: After the page reloads, you’ll see a list of all network requests made by the page, such as HTML files, images, CSS stylesheets, scripts, etc.

Step 8: Click on any individual request to view its details.

Step 9: In the right panel that opens when you select a request, look at the ‘Timing’ tab.

Step 10: In that section, you’ll find detailed timing information, including:
- Blocked time: Time spent in a queue.
- DNS Lookup: Time taken to resolve the hostname.
- Initial Connection: Time taken to establish a connection.
- SSL: Time taken for SSL handshake (if applicable).
- Request Sent: Time taken to send the request.
- Waiting (TTFB): Time to First Byte — the time the server took to respond.
- Content Download: Time taken to download the response.

Step 11: From the ‘Timing’ tab, note down the relevant response times to understand the performance of different resources and the page’s overall loading speed.
By following these steps, you can effectively analyze the response time and performance of web pages in Google Chrome.
Also Read: What is ModSecurity and Its Usage?
2. Mozilla Firefox
To check the website response time in Mozilla Firefox, you can follow these steps:
Step 1: Launch the Mozilla Firefox browser on your computer & visit the website you want to analyze and press Enter.
Step 2: In that, you have to open ‘Developer Tools.’ For this, you have to three methods to follow.
➢ Method 1: Right-click anywhere on the webpage and select ‘Inspect.’

Method 2: Press Ctrl + Shift + I (on Windows) to open the developer tools interface.
Method 3: Open the Application Menu in the extreme right corner (3 short lines).

➔ Select ‘More Tools’ from the drop-down list & click on it.

➔ In that, select ‘Web Developer Tools’ from the list.

Note: After this, you have to follow the steps you did above in Chrome, i.e., from step 5 to step 11, as mentioned in Google Chrome.
Also Read: Fix localhost sent an invalid response ERR SSL_PROTOCOL_ERROR
3. Safari
To check the website response time in Safari, you can use the built-in Developer Tools.
Here are the steps to follow:
Step 1: Launch the Safari browser on your Mac & open the website for which you have to check the response time.
Step 2: Click on Safari in the top menu bar and select ‘Settings’

Step 3: In that, go to the ‘Advanced’ tab.

Step 4: Check the ‘Show features for web developers’ box in the menu bar. This will add a new ‘Develop’ option to the menu.

Step 5: Once the page has loaded, click on ‘Develop’ in the top menu

Step 6: In that, you have to select ‘Show Web Inspector’

Note: After this, you have to follow the steps you did above in Chrome, i.e., from step 5 to step 10, as mentioned in Google Chrome.
By following these steps, you can effectively check the response time of any website in Safari using the built-in Developer Tools.
➢ Online Tools to check response time
There are numerous online tools to check website response time. These tools help you optimize the site performance. These tools also measure loading speed, identify bottlenecks, and provide insights that lead to improvement. Popular options include GTmetrix, Pingdom, and WebPageTest.
➔ Pingdom
Pingdom is a powerful online tool meant to monitor and analyze website response times. This tool ensures that users can quickly identify performance issues and bottlenecks in the website.

Pingdom provides real-time data on website speed, uptime, and downtime. Pingdom also helps website admins understand how their pages perform under various conditions. Users love Pingdom for its user-friendly interface, which simplifies website testing from multiple locations.
Businesses can pinpoint bottlenecks, enhance user experience, improve SEO rankings, and optimize loading speeds using Pingdom.
➔ GTmetrix
GTmetrix is an online tool that provides detailed insights into website performance and response times. It analyzes key metrics like page load speed, total page size, and the number of HTTP requests. GTmetrix helps website owners discover areas for improvement.

GTmetrix allows its users to test websites globally and from various devices. GTmetrix offers complete reports that include actionable recommendations. These recommendations are based on industry best practices, allowing users to optimize their sites for faster loading times and better user experience.
GTmetrix is a great tool for businesses that enables their websites to perform efficiently across different platforms. Overall, GTmetrix is an invaluable tool for anyone looking to enhance their site’s speed and performance for increased engagement and visitor satisfaction.
➔ WebPageTest
WebPageTest is a versatile online tool that helps you assess website performance and response times with remarkable depth and accuracy. WebPageTest enables users to conduct tests from multiple locations worldwide using various devices. WebPageTest offers a total view of how their site performs under different conditions.

The report generated by WebPageTest contains a breakdown of load times, rendering speeds, and resource loading sequences, along with insightful suggestions for optimization.
Developers prefer WebPageTest because of its features, such as filmstrip and waterfall visualizations. WebPageTest allows developers to diagnose issues effectively and enhance user experience by fine-tuning page speed. WebPageTest has robust facilities, which makes it a highly useful resource for website owners to improve their website’s performance and reliability.
➔ Command Line Tools
While we have discussed a few online tools to check website response time, some command-line tools can help you perform the same tasks. These command-line tools are powerful resources that allow developers and system administrators to determine site performance efficiently from the terminal.
Command-line tools like curl, wget, and ping empower users to test the responsiveness of a website. These tools follow the process of sending HTTP requests and measuring the time taken to receive a response.
Experienced administrators can use advanced tools such as ab (Apache Benchmark) and Siege to simulate multiple user requests. These advanced tools offer important and usable insights that highlight the website’s capacity to handle traffic under heavy load.
If you are an ace at scripting, then these command-line utilities offer quick, scriptable options to monitor the site’s performance. Tech-savvy admins believe command-line tools to be an ideal solution for troubleshooting and automating performance checks in various environments.
Also Read: How to find what CMS a website is using?
How to Improve Website’s Response Time?
Now that we have discussed the importance of website response time and methods, as well as tools to check it, let us dive into learning a few techniques and strategies to improve it.
➢ Optimization Techniques
1. Caching strategies
Using caching strategies is the simplest method to enhance your website’s response time. In this method, the frequently accessed data is stored temporarily.
Techniques like browser caching, server-side caching, and content delivery networks reduce website loading times. As a result, the strain on the server decreases and provides users with a smoother browsing experience.
2. Content Delivery Network (CDN)
As part of the optimization technique, using a content delivery network (CDN) to boost your website response time is an effective strategy.
In the CDN technique, content is distributed across multiple servers that are geographically spread across the globe. As a result, users experience minimum latency and enhanced load speeds.
This process also ensures users receive data from their nearest server, which results in a faster, more reliable browsing experience. Time, energy, and effort are saved using CDN.
3. Minimizing HTTP requests
Every HTTP request sent to the server results in a delay in receiving a response from the server. Hence, by minimizing HTTP requests, you can improve the website’s response time.
Developers can reduce the number of elements on a page, such as images and scripts. They can send combined files, which can help decrease load times, enhance performance, and create a smoother user experience.
Also Read: What is the Difference Between HTTP and FTP?
➢ Server and Infrastructure Optimization
A few techniques that fall under the server and infrastructure optimization category help improve the overall website response time. These techniques mainly fine-tune the server resources so that they become capable of balancing the load and managing the traffic.
1. Upgrading server resources
When your server begins to lag in its performance, the primary reason is that it cannot handle the requests and the traffic. In such scenarios, the suggested solution is to upgrade the server resources.
Server administrators can increase CPU power, memory, and storage capacity to boost server performance and enhance website response time. The new and improved hardware will ensure faster data processing, reduced latency, and better handling of traffic spikes, delivering a smoother and more efficient user experience.
2. Database optimization
Besides important resources, every website has a database containing necessary information. Over time, it becomes essential to optimize this database to enhance website response time. The database optimization results in streamlining data retrieval processes.
Various techniques like indexing, query optimization, and regular proactive maintenance reduce load times and improve efficiency. Following this strategy will ensure that users receive instant access to information and enjoy a more fluid browsing experience.
3. Code optimization
A code is the soul of every website. Hence, with time, you must optimize your website’s code to enhance website response time. All you need to do is refine and simplify the underlying code.
Using proven techniques like minification, removing redundant scripts, and employing efficient algorithms will help reduce file sizes. It would additionally decrease the processing time, resulting in quicker load times. With less processing time and fast loading time, users will get a smoother, more responsive browsing experience on your website.
Also Read: How to Fix This Site Can’t Be Reached the Connection Was Reset
➢ Network Optimization
Considering that the website and the server where it is hosted have been optimized, it is time to shift your focus to optimizing your network. Improving your network will ensure efficient data transmission through the data channels.
You may use proven techniques such as optimizing image and multimedia files, compressing files, and setting up reliable internet connection, which ultimately results in a seamless experience for users globally.
1. Use compression techniques
To optimize your network, you can use the compression technique, where the file sizes for HTML, CSS, and images are reduced (or compressed). This method greatly decreases the delay faced in loading the site, improves the data transfer process, and smoothens the user browsing experience for increased engagement and satisfaction.
2. Optimize images and multimedia files
Images and multimedia files are heavier and bigger compared to other file types. Hence, they take up more bandwidth, which results in low network performance and poor website response time.
You can resolve this issue by using techniques like resizing, compressing, and using the appropriate formats to minimize file sizes. These methods will enhance loading times, improve user experience, create engagement opportunities, and decrease bounce rates for your website.
3. Ensure reliable and fast internet connectivity
The internet is the only channel through which you send and receive data for your website. Hence, it is crucial to set up a reliable and faster internet connection that effectively optimizes the network and improves your website response time.
To offer a seamless browsing experience to your users, always insist upon having a high-quality bandwidth, optimizing routing, and minimizing latency. Allow your users to access the content with ease. This will result in improved engagement, lower bounce rates, and higher customer satisfaction across devices.
➢ Front-end Optimization
Front-end optimization is a useful technique to help you improve your website’s response time. In this method, you can ask your technical team to refine the website code structure, minimize HTTP requests, and utilize asynchronous loading for scripts.
They can also help you by implementing caching assets and leveraging content delivery networks to streamline resource delivery systems. The result will be faster load times and an improved user experience.
1. Minimize CSS and JavaScript files
Trying to minimize your CSS and JavaScript files will work wonders by enhancing your website response time. In this method, your front-end developer will delete unnecessary code and combine files to reduce their sizes.
As a result, the download time will decrease, and the overall performance will be improved, leading to a smoother user experience and faster loading of your website.
2. Use asynchronous loading for non-critical resources
You might have a few non-critical resources that you may load asynchronously. This method will significantly enhance website response time. There is a logic associated with this approach.
Here, the essential content will load first, followed by secondary scripts and styles, which will be loaded in the background. Implementing this dual logic will reduce initial load times, improve user experience, and ensure quicker access to vital information.
3. Implement lazy loading for images and videos
In this unique concept, the loading of non-visible content is delayed until users scroll to that section. This concept is called lazy loading for images and videos, which helps enhance website response time.
This method is unique because it reduces the initial page weight, which speeds up the loading times and improves website performance. This technique results in improved user experience and a decrease in bounce rates.
➢ Monitoring and Continuous Improvement
All the strategies we discussed have proven records. Still, it is essential to monitor their outcomes and make continuous improvements to ensure optimal website response time.
Count on your instincts to identify performance bottlenecks, make timely adjustments, and deliver a seamless experience to your users.
1. Regularly monitor website performance
Once your website is up and running, you cannot leave it and wait for it to become successful. What you must always do is regularly monitor its performance. This approach is both crucial and essential for improving its response time.
Tracking metrics like load speeds, error rates, and user interactions helps your developers identify issues, find ways to optimize resources, and make mandatory adjustments, ensuring a seamless browsing experience for visitors.
2. Set performance benchmarks and goals
Once you have identified the bottlenecks and brought in necessary improvements, you will start witnessing performance on your website. It’s great that your website is now performing. Still, it is also essential to set performance benchmarks and goals to deliver excellence in terms of the website’s response time and user experience.
You must establish a clear set of metrics for speed and user experience; ask your team to track the progress regularly, identify opportunities for improvement, and implement targeted optimization strategies. These techniques will soon offer better engagement and superior satisfaction to your users.
3. Continuously optimize and refactor code.
A vital approach will be to ask your team to optimize and refactor the website’s code regularly. This process will help you enhance the website’s response time by streamlining algorithms, reducing complexity, and eliminating redundancies.
It will additionally lead to faster execution of tasks, improved loading speeds, and an efficient user experience. When you achieve this, you get to see more visitor engagement and satisfaction with a drop in bounce rates.
Also Read: How to Fix Err Tunnel Connection Failed in Chrome
Conclusion
This knowledge base has exhaustively addressed the importance of checking a website’s response time. In this blog, we have discussed what website response time is, the methods to check it, the available tools to simplify your task, and the techniques to improve your website response time for a better user experience.
The available tools, like WebPageTest, GTmetrix, and Pingdom, offer you great insights into loading speeds and performance scores and suggest improvements. Using these insights and suggestions, website owners can maximize positive user experience, decrease website bounce rates, and enhance overall brand credibility.